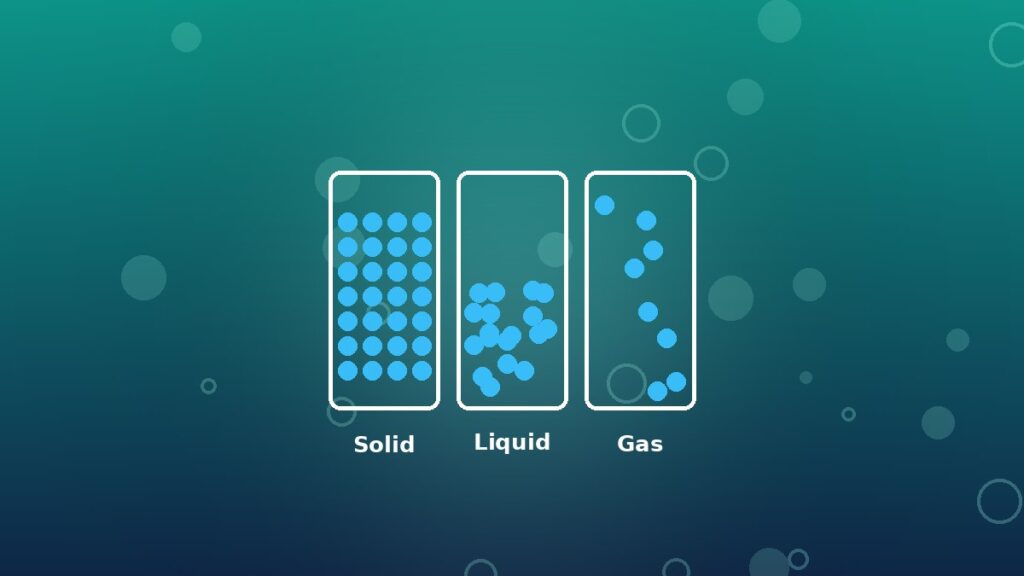
Students can recite “solids vibrate, liquids flow, gases spread out” long before they understand why. PhET’s free States of Matter simulation shows the particles themselves: neon atoms locked in a lattice, argon sliding as a liquid, water molecules flying apart as steam. Students heat, cool and compress them and watch the temperature and pressure respond.
This guide gives you a 50-minute lab for grades 7–12, real melting and boiling data to compare with the simulation, and a free printable worksheet with a teacher answer key.
Free worksheet: 14 questions in five parts, a particle-model table and a full answer key. US Letter.
In this guide7 sections
Lab at a glance
| Grade level | 7–12 (physical science, chemistry) |
| Time | 45–60 minutes |
| Simulation | States of Matter: States, Phase Changes and Interaction screens |
| Big ideas | Particle model, kinetic energy and temperature, phase changes, gas pressure, intermolecular forces |
| Students will | Describe particles in each state, explain phase changes with energy, explain pressure, connect attraction strength to boiling points |
| Where to open it | Our science simulations page or the PhET website |
Know the simulation in 3 minutes
- States screen: choose neon, argon, oxygen or water, then jump straight to solid, liquid or gas with three buttons. A slider on the bucket under the container heats or cools the substance, and a thermometer shows the temperature in kelvin or Celsius.
- Phase Changes screen: adds a pressure gauge, a pump to add particles, a finger that pushes the lid down, and a live phase diagram with a red dot showing the current state. There is also an “adjustable attraction” substance.
- Interaction screen: shows just two atoms and a graph of potential energy against distance, so students can feel the attraction and repulsion between particles.
One fun detail: if the pressure gets too high on the Phase Changes screen, the lid blows off. Students will discover this on their own, so plan for a minute of excitement.
Step-by-step lesson plan
Part A: Solid, liquid, gas (10 minutes)
On the States screen, students click through solid, liquid and gas for each substance and fill in a table: arrangement, motion and whether the particles fill the container. The key insight: the particles are the same in every state; only their spacing, motion and energy change. Ask them to convert the thermometer reading to Celsius. Solid neon sits at about 14 K, which is −259 °C.
Part B: Heating and cooling (15 minutes)
Students start with solid argon and heat it slowly. They watch the particles vibrate harder, break free to slide past each other, then fly apart. They record the approximate melting and boiling temperatures, then repeat with water.
Real data makes a great comparison. The simulation uses a simplified model, so its numbers are close to these but not identical:
| Substance | Melting point | Boiling point (at 1 atm) |
|---|---|---|
| Neon | 25 K (−249 °C) | 27 K (−246 °C) |
| Oxygen | 54 K (−219 °C) | 90 K (−183 °C) |
| Argon | 84 K (−189 °C) | 87 K (−186 °C) |
| Water | 273 K (0 °C) | 373 K (100 °C) |
Ask the class why water’s numbers are so much higher. Water molecules attract each other far more strongly than noble gas atoms do (through hydrogen bonds), so much more energy is needed to pull them apart.
Part C: Pressure and the phase diagram (15 minutes)
On the Phase Changes screen, students make neon a gas and then change one thing at a time while watching the pressure gauge:
- Push the lid down (smaller volume): pressure rises, because particles hit the walls more often.
- Pump in more particles: pressure rises, because there are more collisions each second.
- Heat the gas: pressure rises, because particles move faster and hit harder.
These are the gas laws, explained with particles before any equations. The phase diagram’s red dot then shows how temperature and pressure together decide the state, and where the triple point and critical point sit.
Part D: Why particles stick together (10 minutes)
On the Interaction screen, students pull two atoms apart and push them together. They find almost no force at long range, attraction at medium distance and strong repulsion up close. The lowest point of the potential energy graph shows the “comfortable” distance between particles in a solid or liquid. Raising the interaction strength predicts higher melting and boiling points, which ties back to the water result in Part B.
Common misconceptions to watch for
- “Particles in a solid don’t move.” They vibrate constantly. Only at absolute zero (0 K) would that motion reach its minimum.
- “Gas particles are bigger.” Particles are the same size in every state; only the space between them changes.
- “There is air between gas particles.” There is nothing between them: empty space.
- “Temperature and heat are the same.” Temperature measures the average kinetic energy of the particles; heat is energy transferred between objects.
- “Water only evaporates at 100 °C.” Evaporation happens at any temperature, from the surface; boiling happens throughout the liquid at the boiling point.
Extension ideas
- Gas law data: on the Phase Changes screen, record pressure at different temperatures with a fixed number of particles and graph it. It should be roughly a straight line, pointing toward zero pressure near 0 K.
- Cooking at altitude: at lower air pressure, water boils below 100 °C. Ask students to explain why pasta takes longer to cook in the mountains.
- Pair with energy: our Energy Skate Park lab teaches energy transformation, which explains where the energy goes during melting and boiling.
How to review it later
A few days after the lab, ask three questions from memory: what changes when a substance melts, why compressing a gas raises its pressure, and why water boils at a higher temperature than argon. Short self-tests like these are what make a lab stick. See our guide to active recall for more ways to review, and use our Gravity and Orbits lab or circuit lab for other units in the same worksheet format.
Frequently asked questions
What does the States of Matter simulation teach?
It teaches the particle model of solids, liquids and gases, how heating and cooling cause phase changes, how volume, temperature and the number of particles affect gas pressure, and how attraction between particles affects melting and boiling points.
Is there a simpler version for younger students?
Yes. PhET also publishes “States of Matter: Basics,” which has fewer controls and suits middle school. The full version used here includes the Interaction screen and phase diagram.
Why are the simulation’s temperatures slightly different from real data?
The simulation uses a simplified model of how particles interact, designed to show the behavior clearly rather than to reproduce every measured value. That difference is itself a good discussion about what scientific models are for.